Management
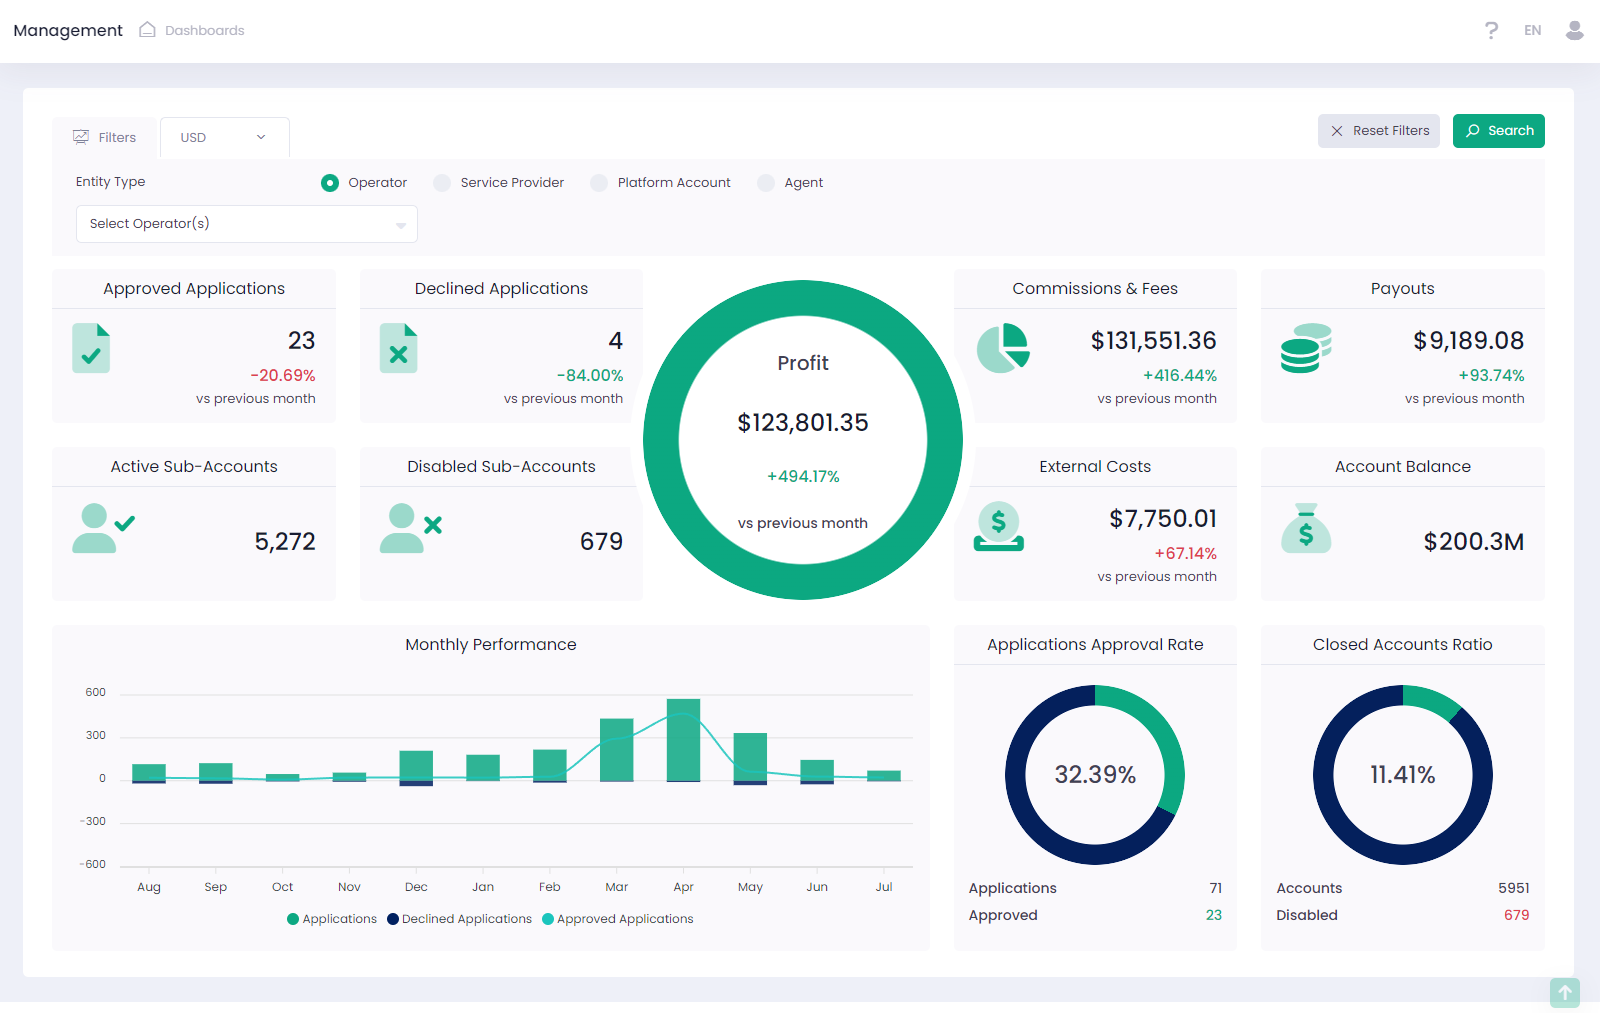
Management dashboard displays key indicators of business development for the current month compared to the same period of the previous month (‘Active Sub-Accounts’ and ‘Disabled Sub-Accounts’ widgets display data as of the beginning, not just for the current month).
The data displayed on the dashboard is aggregated per business entities with type selected in the ‘Entity Type’ filter and of course only displays the entities to which the user has account permissions. Management dashboard is available for Operator managers, Service Provider Admins and similar custom roles.
Dashboard filters
Tab ‘Filters’ contains two filters:
- Entity type – use to specify the business entity level at which to aggregate data (for example, if Entity type is set Operator, this means that data for widgets is calculated based on Operator data);
- selection of specific business entities – allows to calculate and display data for specific business entities with level selected in ‘Entity type’ filter.
The currency filter allows to aggregate data in the selected currency.
Filter settings are saved to the browser’s local storage and then are applied as default the next time you log in.
Widgets
Profit – displays the financial indicator of profit and its dynamics compared to the previous month. By clicking on the widget, you will be redirected to Profitability Analysis report.
Commissions & Fees – displays data about fees, and the relative change compared to the previous month. By clicking on the widget, you will be redirected to Commissions And Fees report.
Payouts – displays data about Payouts, and the relative change compared to the previous month. By clicking on the widget, you will be redirected to Payouts report.
External Costs – displays the financial indicator of External Cost and its dynamics compared to the previous month. By clicking on the widget, you will be redirected to Profitability Analysis report.
Account Balance – displays the sum of account balances of business entities of the selected entity type. By clicking on the widget, you will be redirected to Account Balance report.
Approved Applications – displays the number of approved applications, and the relative change compared to the previous month. By clicking on the widget, you will be redirected to Applications page.
Declined Applications – displays the number of declined applications, and its relative change compared to the previous month. By clicking on the widget, you will be redirected to Applications page.
Applications Approval Rate – displays the approval rate of applications. By clicking on the widget, you will be redirected to Applications page.
Monthly Performance – displays the dynamics of the number of applications (total, approved and declined) for the last 12 months.
Active Sub-Accounts – displays the total number of active sub-accounts for the whole period. By clicking on the widget, you will be redirected to Sub-Accounts page.
Disabled Sub-Accounts – displays the number of disabled sub-accounts for the whole period. By clicking on the widget, you will be redirected to Sub-Accounts page.
Closed Accounts Ratio – displays the ratio of disabled accounts to total number of accounts for the whole period. By clicking on the widget, you will be redirected to Sub-Accounts page.