Management Dashboard
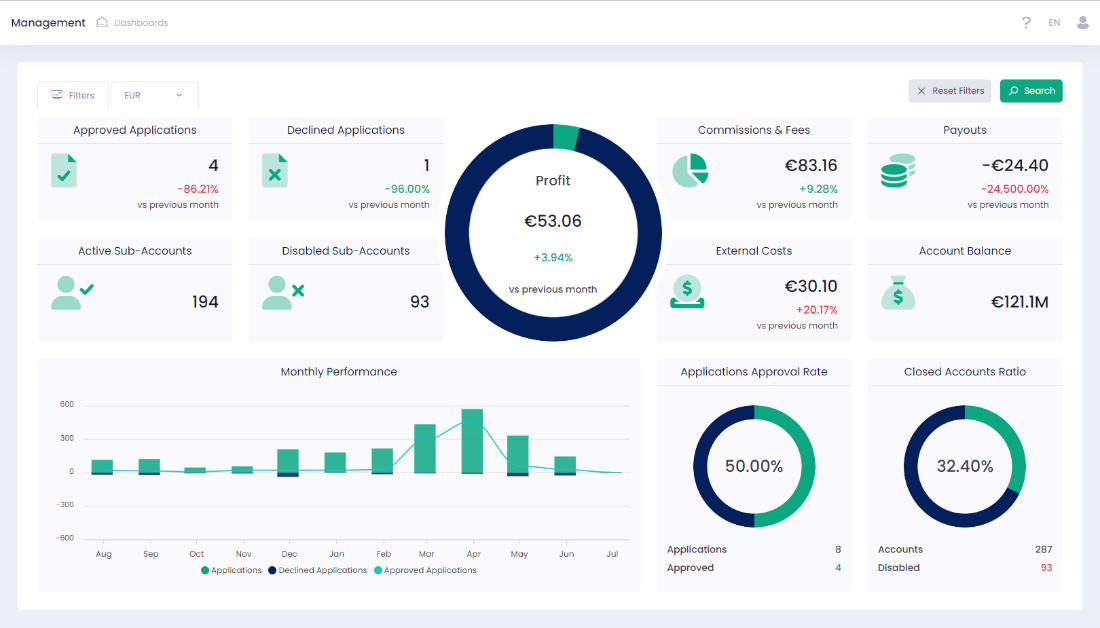
The Management dashboard has been updated to show key indicators of business development for the current month, aggregated at the level selected in the ‘Entity Type’ filter. It includes the following widgets:
- Profit – displays the financial indicator of profit and its dynamics compared to the previous month.
- Commissions & Fees – displays data about fees, and the relative change compared to the previous month.
- Payouts – displays data about Payouts, and the relative change compared to the previous month.
- External Costs – displays the financial indicator of External Cost and its dynamics compared to the previous month.
- Account Balance – displays the current account balance.
- Approved Applications – displays the number of approved applications, and the relative change compared to the previous month.
- Declined Applications – displays the number of declined applications, and its relative change compared to the previous month.
- Applications Approval Rate – displays the approval rate of applications.
- Monthly Performance: – displays the dynamics of the number of applications (total, approved and declined) for the last 12 months.
- Active Sub-Accounts – displays the total number of active sub-accounts for the whole period.
- Disabled Sub-Accounts – displays the number of disabled sub-accounts for the whole period.
- Closed Accounts Ratio -displays the ratio of closed accounts.
These updates provide a comprehensive overview of key business development indicators for better management decision-making.